
Raosoft, Inc., Seattle,
WA
206-525-4025
raosoft@raosoft.com
206-525-4025
raosoft@raosoft.com
|
|
Raosoft, Inc., Seattle,
WA
206-525-4025 raosoft@raosoft.com |
|
Below are thumbnail images of reports that were created with Raosoft SURVEYWin Analysis and EZReport. You can click on an image below to see a larger image or you can click here and download a zip file containing all of the reports.
Single Variable
|
Single Variable
|
Single Variable |
Multiple Variable 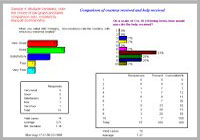 |
Grouped Questions  |
Multiple Weighted  |
Stacked Bar  |
Pivoted Stack Bar 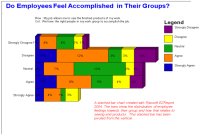 |
Gap Analysis 3-D  |
Gap Analysis 2-D  |
Custom Data 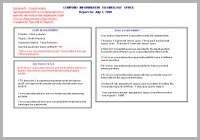 |
Single Variable 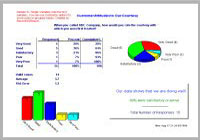 |
Group Table  |
Summary Pareto 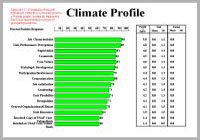 |
Weighted Questions 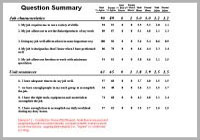 |
Trend Analysis - 1  |
Trend Analysis - 2  |
Comment Processing  |
Special Bar Chart - 1  |
Special Bar Chart - 2  |
Special Chart Instructions  |
| Below are a few images of the EZReport 2007 new features. | ||
| Query and Crosstabulation options | ||
| Comment Analysis by Crosstab and Query 
|
Comment Analysis Setup for Report 
|
Crosstab and Query Results within EZReport 
|
| Comment Metrics | ||
Count Responses GUI 
|
Count Responses Setup for Example 
|
Response Count in Finished Report 
|