|
 Quick and easy to use, since RapidReport makes repetitive graphics for you.
Opens data created by Raosoft EZSurvey, SurveyWin and InterForm. Available from
within EZSurvey, so there is no need to leave the EZSurvey program.
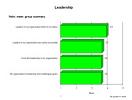
Creates a set of default reports. The responses to each question are displayed as bar or pie charts with appropriate page numbers and texts.
Sorts the questions.
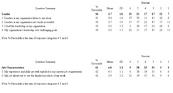
Aggregates rating scales, to join, e.g. all positives or all negatives.
Imprints default date and time stamps.
You may customize the graphs: Change size/position/colors, add/remove text, change to a pie chart (2-D or 3-D chart) or table, delete unwanted graphs.
Lets you preset a group of questions (e.g. demographic questions) to display on the
charts (currently functional in InterForm and for later addition to EZSurvey and
SurveyWin).
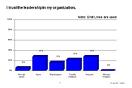
Within EZSurvey, SurveyWin, and InterForm the questions can be put into Groups of questions. Then RapidReport can create graphs which are summaries of these categories of questions (currently functional in InterForm and for later addition to EZSurvey and SurveyWin).
Do a simple query to show a breakdown for a question (e.g. how many Males vs. how many Females approve of their leadership).
These query groups are pre-made using the form authoring tool.
Provides an export summary.
Individual graphs or pages can be: Printed out, copied to the clipboard or pasted into MS Word or PowerPoint. The entire set of graphs can be saved in PDF format (in full color) for web distribution.
| 
 Raosoft RapidReport:
Multiple reports in an instant from Raosoft survey
software!
Raosoft RapidReport:
Multiple reports in an instant from Raosoft survey
software!